
The Mythical Average 10% S&P Returns

It’s the season of economic forecasts, and financial pundits everywhere are rolling out their predictions for the S&P 500.
Oppenheimer’s Chief Investment Strategist, John Stoltzfus, forecasts the S&P 500 reaching 7,100 by the end of 2025, citing resilient economic growth and advancements in artificial intelligence (AI) as key drivers. Meanwhile, Morgan Stanley & Goldman Sachs have both set their targets at 6,500, predicting an 8% price gain, supported by expectations of earnings growth and favorable economic policies.
These forecasts sound precise. They seduce us into believing the market is far more predictable than it really is. None of these forecasters explain how they projected their targets or why smart analysts examining the same data often arrive at wildly different conclusions.
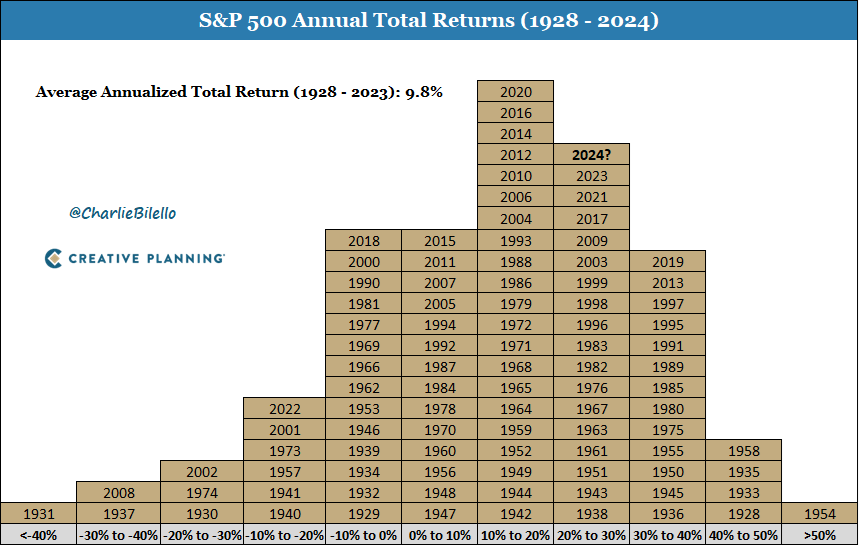
Take the oft-cited “average annual return” of 10% for the S&P 500.
It’s a neat, round number that seems to suggest that the market should return 10% regardless of what happens. But how can that be? If the market goes up too quickly, economic gravity must pull it down, and if the market lags, then it is eventually pulled up by economic reality.
So logic would dictate that the average of 10% is far more lumpy than the forecasters would have you believe.
The Illusion of "10% Returns"
Look at the following data derived from 7,776 daily data points over the last 30 years. It examines the annual return if you bought the SPY ETF and held it for one year starting from any day:
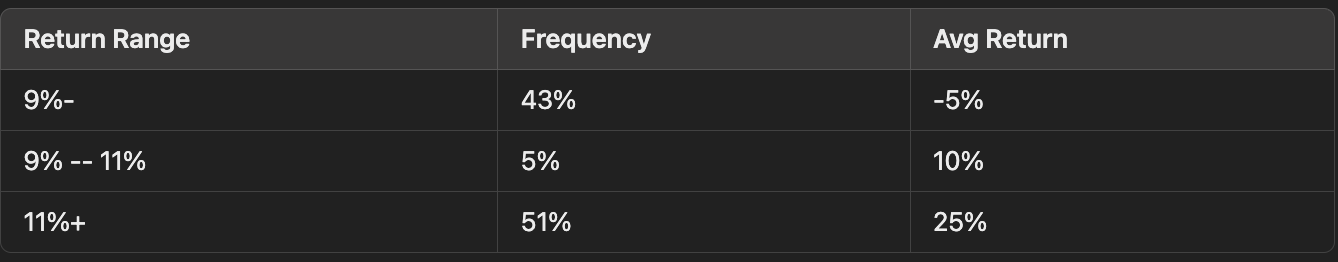
The average annualized return is 10%, but it tells you almost nothing about what to expect in any given year.
In fact:
51% you would have averaged a large positive return — an average return of 25%.
43% of the time, your return would have been negative — an average return of -5%. Of those about 22% of the time expect an average return of -10%, and 5% the rest of the time.
Only 5% of the time your return would have hovered near the so-called average of 10%.
This is a far cry from the 10% average often paraded by financial advisors and analysts.
The 10% figure is not a reliable expectation.
Expectation vs. Reality
Instead of relying on the mythical "average" 10% return, a more realistic expectation is:
40% of the time, you should expect a small negative return.
Of these half the time expect a small positive return and half the time expect a medium negative return (~-10%)
60% of the time, you should expect a large positive return.
This reflects the market's natural volatility and uneven distribution of returns. Markets are not Gaussian; they don't cluster neatly around an average. Rather, they are skewed, with extreme outcomes (both positive and negative) shaping the long-term averages.
Forecasts: The Ultimate Intellectual Fraud
This data obliterates the credibility of predictions built on averages. Financial forecasters offering tidy S&P 500 price targets (like Goldman Sachs’ forecast of 6,500) fail to account for the reality that most returns will be nowhere near the average.
If you follow such predictions blindly, you risk building a portfolio for a world that doesn’t exist—a world of smooth averages and predictable outcomes.
Investing in the Real World
To succeed as an investor, you must abandon the comfort of averages and embrace the reality of volatility:
Plan for extremes. Your portfolio should withstand both prolonged downturns and unexpected windfalls.
Focus on robustness, not precision. Precision is a delusion in a world ruled by randomness.
Avoid reliance on forecasts. Most are noise, not signals. The more short-term the forecast, the less useful it is.
A Parting Thought
The next time you hear someone cite the “average” 10% annual return of the S&P 500, remember that the market’s reality is far messier, wilder, and more interesting. Averages don’t prepare you for the journey—they’re a poor map for a volatile terrain.
As Nassim Taleb might say, “Don’t confuse the map for the territory.”
In the stock market, the territory is unpredictable, and the only certainty is uncertainty.